Effective Monitoring & Evaluation of Health & Nutrition Program Performance

By: Ashu Sikri, Product Strategist, Digital Green

CoCo

Digital Green collects information related to program performance from the community level, to monitor the performance of its agriculture and livelihood programs, which is uploaded on its web-based monitoring system called Connect Online Connect Offline (COCO). Major indicators regarding the effectiveness of program implementation are publicly accessible with the help of a web-based analytics dashboard. However, learning from initial pilots of health and nutrition projects (since 2012) highlighted that although there is an increase in knowledge and adoption of behaviors these are not physically verifiable nor as tangible as they are in agriculture and livelihood programs.

Thus, when we started the implementation of project Samvad in 2015, we knew it would be difficult to collect and monitor the information through COCO. Hence, in order to regularly track the increase in knowledge, practices, and behavior change outcomes of Samvad we developed an innovative design of periodic lean surveys in partnership with the London School of Hygiene and Tropical Medicine (LSHTM). LSHTM provided technical support to our Monitoring, Learning & Evaluation (MLE) team to execute the lean survey.

The lean survey monitors and evaluates the implementation of the Samvad project and seeks to understand and improve the outcomes and impact and are carried out in five states where the project is active, namely Bihar, Jharkhand, Odisha, Chhattisgarh, and Uttarakhand.

In Bihar and Jharkhand where the program implementation started earlier and is in a more advanced stage of implementation, the surveys are carried out every quarter and in others, biannually.

Statistical Process Control

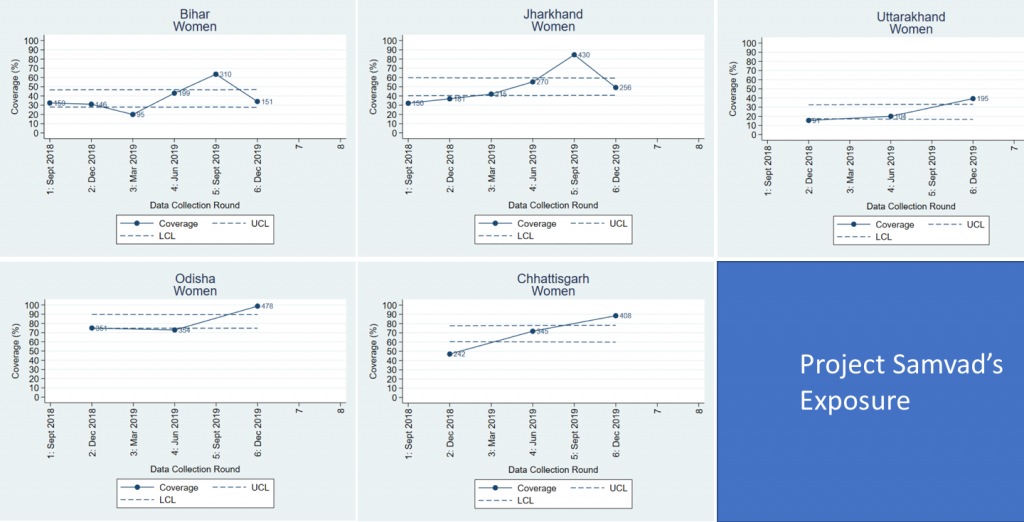
To monitor the outcomes and processes of the Samvad project, we used an innovative method of lean survey which uses Statistical Process Control (SPC) method. SPC ensures regular monitoring of improvement in the implementation system, processes, and outcomes, and has its basis in the theory of variation. This helps us understand common and special causes of occurrence of an incidence (outcome or process) and its consistency and variability longitudinally throughout the period of program implementation.

With SPC, the outcomes of the intervention can be depicted chronologically through graphical representation. These graphs, called ‘control charts’ show program outcomes with upper and lower control limits based on the variability. These charts have a central line depicting the average of an outcome and two dotted lines representing upper and lower control limits. The control limits usually depict plus/minus 3 standard deviations from the mean. The control charts indicate a change in outcome when it exceeds the control limits. With the help of these control charts, one can easily identify consistency or variation within an outcome throughout the implementation process.

Since this method clearly shows the changes that occur on a continuous basis, it is useful for the purpose of monitoring and course correction, where needed. Moreover, SPC harnesses the power of classical significance tests and it is equally useful to understand the impact of a program and its exposure among the targeted populations. Surveys conducted using SPC help inform the program strategies and course correct. Information on SPC in further detail may be accessed here.

The control charts above show that the proportion of women who have been exposed to Samavd intervention. It showed that:

  • The exposure of married women (aged 15-34 or women with a child under two years) to Samvad intervention has increased in all states except in Bihar from the initial round (Sep 2018 in Jharkhand and December 2018 in Odisha, Chhattisgarh, and Uttarakhand to December 2019).
  • In Bihar, the exposure level has been within the control limits except in round 3 and 5.
  • In Jharkhand, in the first round, the exposure was below the control lines and in round 2 to 6, it has been within the control limits.
  • In the other three states, the exposure level has exceeded the control limits indicating a definite increase in the exposure level.

One of the major reasons for different levels of exposure to Samvad intervention in different states is the way the implementation partners in different states disseminate the videos. In Bihar, the videos are disseminated by frontline workers of the livelihood mission to the members of self-help groups. These self-help groups include members of all age groups but women of the target age group are relatively lower in number. This may be one of the reasons that the percentage of women exposed to Samvad videos is relatively lower than those of the other states. In Odisha, the videos are disseminated by an NGO which has greater control over their video disseminators and this along with their rigorous capacity building may have resulted in a higher level of women’s exposure. In Uttarakhand, the video disseminations started late and thus the exposure of women to the Samvad intervention is low.

These surveys have helped us in tracking the Samvad intervention exposure, knowledge and behaviors of communities, and also the availability of supplies. Tracking of program performance over the period has helped timely course correction of the strategies for improved health and nutrition outcomes.

Tracking the availability of commodities

Through the lean survey, we also track the availability of maternal, child nutrition, and family planning commodities at the village level with health and nutrition functionaries. For example, in the 6th round of the survey, in December 2019, we found that iron and folic acid (IFA) tablets which are important for preventing anemia among pregnant women, were not available in 25% of the villages surveyed in Bihar, 19% in Jharkhand, 33% in Chhattisgarh, 3% in Odisha and Uttarakhand each. Such a gap in the supply hampers the demand and adoption of practices promoted by the program.

Screen-Shot-2020-09-28-at-7.24.47-PM

Conclusion

Lean surveys have the unique strength of serving the purpose of program surveillance to understand the current performance and also to assess the impact of any intervention. The statistical process control method used in these surveys brings the rigor of classical statistical methods with time-sensitivity to programmatic improvement and makes them more useful than the traditional survey methods. The lean survey method can be used for other similar programs where tracking of outcomes is not feasible through ongoing program reporting.

If you’d like to like to learn more about this check out this webinar recording.